top of page

Anchor 1
Creating a Discovery feature that enables users to efficiently discover what they want to watch based on their time, mood, company. It aimed to eliminate the "Decision Fatigue" of users.
A project in TATA Elxsi that was required to build and design a Hybrid TV (a combination of Satellite TV - Direct to home service and and Over the Top app for an international media company.
With the help of my mentor, Mr. Chandrashekar Seivur, I collaborated with multiple people from the team which included designers and developers.
Over the course of 5 months, I helped in designing the interface and did my own research to come up with the most common faced problem of "What do I feel like watching?"
It was certain that most people were facing the “Hick’s Law” on OTT apps. According to Hick’s Law, more decision the user has the more time they would take to “respond”.
R O L E
UI/UX Design Intern
D A T E
Dec'19 - March'20
I N D U S T R Y
Media & Broadcasting


Artificial Intelligence, Machine Learning, Deep learning
This gives a very streamlined options to the user, and does not enable a chance of "discovery" or watching something new.
These are used to prove personalised content
OTT platforms can provide better services to their users if they have a better understanding of their choices. With AI solutions OTT providers can learn about user preferences, the shows they like, the shows they hate, and the amount of time spent on their platform.


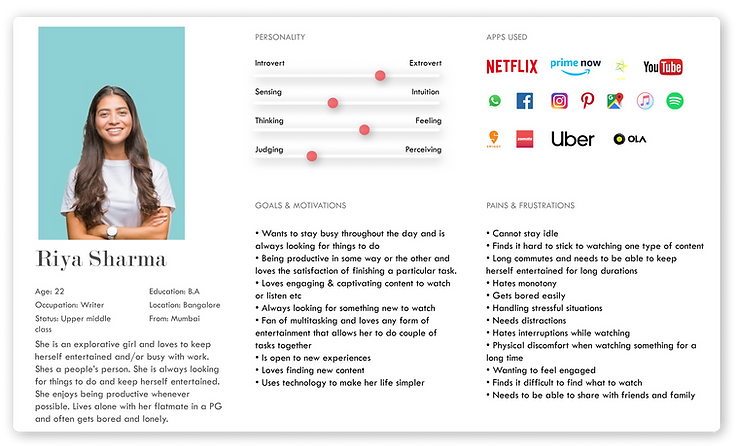
Personas

Brainstorming & Ideation


Conclusion of all the research


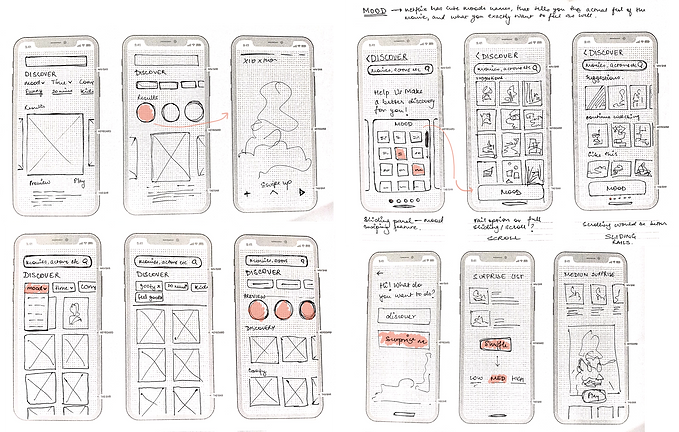
Skecthes & Wireframes

Anchor 2


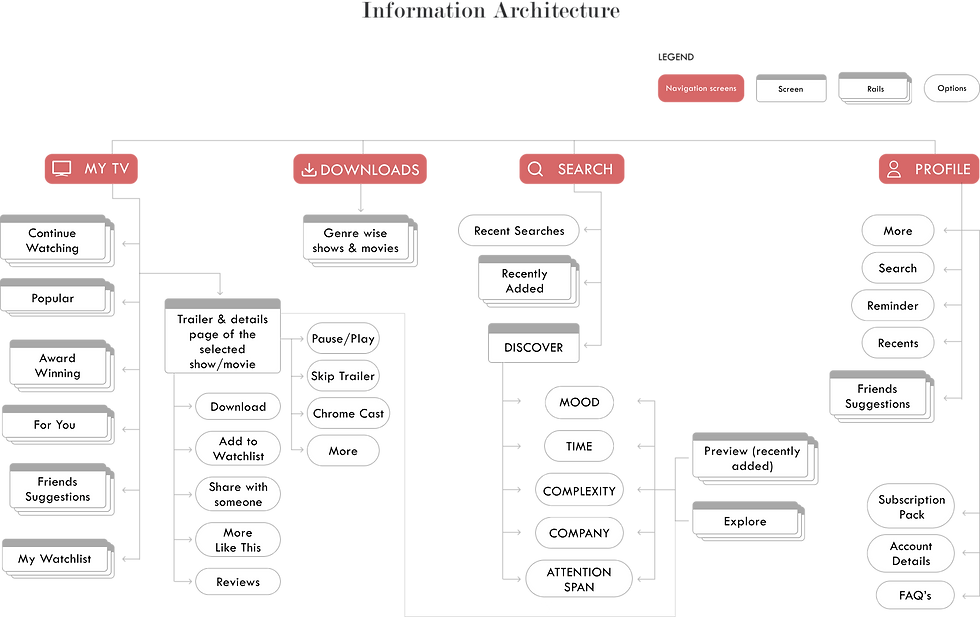
Introducing the Discovery Feature


Learnings
-
Being able to think critically and logically. E.g Understanding why sometimes certain UI trends (e.g. neuomorphism) don't work out and could require a lot of development effort which could be conflicting with the deadlines provided
-
Iterating, iterating, iterating. Coming back to various steps in the process of design and understanding it is not a linear process.
-
Gathering user feedback by usability testing and implementing the most common feedback rather than making changes to the entire product.
-
Presenting data visually is much easier to grasp than words
bottom of page